Guides · Tutorial
A sales dashboard in PowerBuilder: KPI tiles, charts and a gauge, live
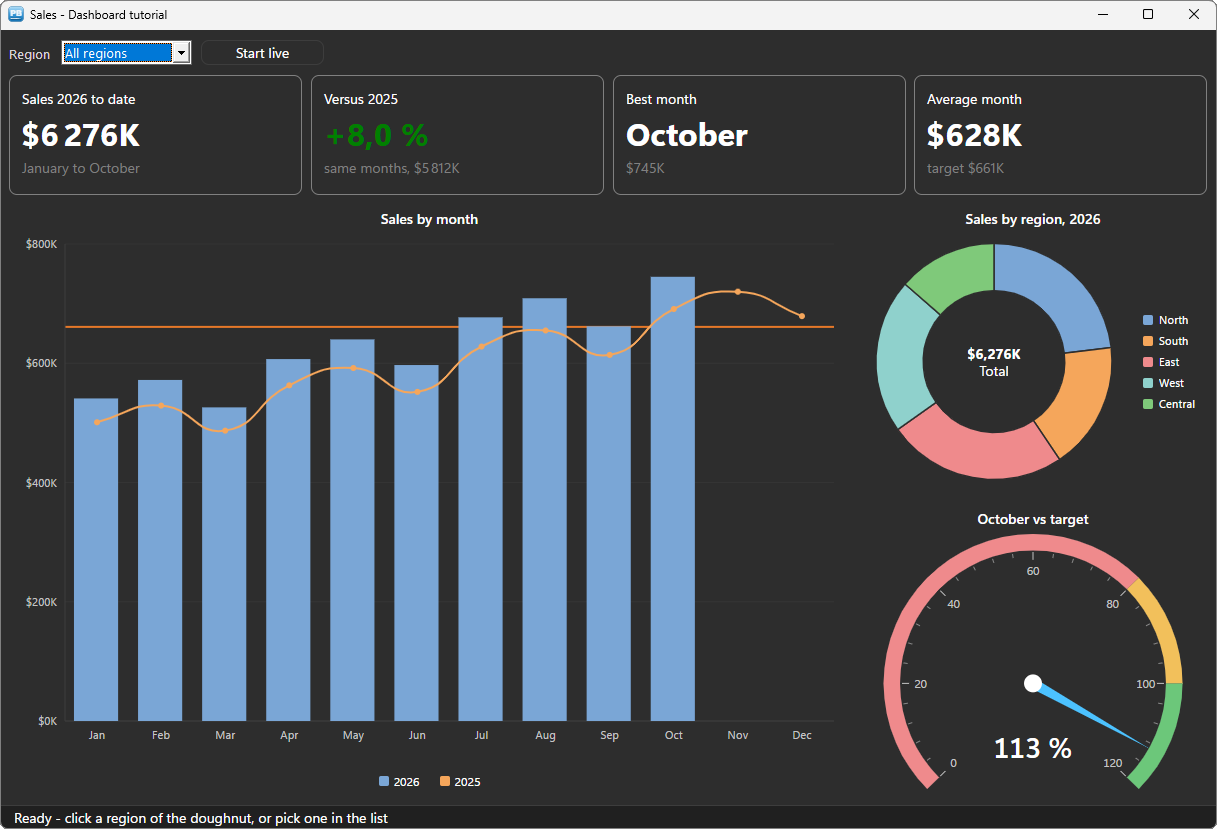
A dashboard is often the first screen a manager opens, and the one that ages a PowerBuilder application the fastest: the graph DataWindow draws flat 3D bars, a pie never animates, and a gauge does not exist. This tutorial builds a modern sales dashboard in a PowerBuilder window with PBToolboxAI: KPI tiles in rich text, a column and line chart with a target, a doughnut that filters the page when clicked, a gauge, and a live mode where the figures move as orders arrive.
Everything is driven in PowerScript, from PowerBuilder 10.2 to 2025, with no ActiveX and no .NET. Every line of code below comes from the sample application: the window w_tuto_dashboard of the PBToolboxAI demo, opened by its Tutorials tab.
What you need #
- PowerBuilder 10.2 → 2025 (32 or 64 bit).
- Windows 10 or 11: the Microsoft WebView2 runtime the components rely on is already there.
- The PBToolboxAI demonstration package — free, from the downloads page. It holds
pbtoolboxai.pbl,pbtoolboxai.dlland the sample application of this tutorial.
The finished code. Open
pbtoolboxai_demo.pbwfrom the demonstration package and run it: the Tutorials tab of its ribbon opens the sample of this tutorial, the windoww_tuto_dashboard, with its DataWindow objectd_tuto_sales. Their source is inpbtoolboxai_demo.pbl, ready to read or to copy.Demo mode. In your own application, without a licence key, each chart runs in demo mode — three series, five slices, three ranges of a gauge — with a small DEMO badge. The tiles are
u_pbt_statictext, which is free.
Step 1 — Prepare the target and the window #
- Copy
pbtoolboxai.pblinto your application folder and add it to the library list of your target. - Copy
pbtoolboxai.dll— the x86 copy, since the PowerBuilder IDE is 32-bit — next topbXXX.exeor into the working folder of the target. - Set the licence and the theme in the
openevent of the application object, as in the other tutorials:PBT_SetLicense(...)thenPBT_SetDefaultTheme("fluent-dark").
In the window painter, place the components — each one is a userobject of pbtoolboxai.pbl:
| Control | Class | Role |
|---|---|---|
uo_kpi_ytd, uo_kpi_growth, uo_kpi_best, uo_kpi_average | u_pbt_statictext | The four KPI tiles |
uo_chart | u_pbt_chartcartesian | Sales by month, this year and last |
uo_pie | u_pbt_chartpie | Sales by region |
uo_gauge | u_pbt_angulargauge | This month against its target |
Add a DropDownListBox ddlb_region, a u_pbt_button named uo_live and a u_pbt_statusbar named uo_status. The sales are in a DataStore of d_tuto_sales: one row per region, year and month, in thousands of dollars.
Step 2 — Build once, refresh often #
A dashboard has two moments. When the window opens, the charts are built: their series, their slices, their ranges. Each time the data changes, they are refreshed: new values for what is already drawn. Keeping the two apart is what makes the charts animate instead of being redrawn from scratch.
// open event of the window
// The sales, then the dashboard around them
ids_sales = create datastore
ids_sales.DataObject = "d_tuto_sales"
wf_load()
wf_build()
wf_layout()
wf_refresh()
The chart #
// wf_build () (extract)
// The chart : the months on the category axis, amounts in thousands of dollars
uo_chart.is_title = "Sales by month"
uo_chart.is_format = '$#,##0"K"'
uo_chart.of_set_categories(/*labels*/ ls_months)

// This year as columns, last year as a line : one series each, filled by wf_refresh
uo_chart.of_add_series(/*key*/ "this", /*label*/ String(THIS_YEAR), /*type*/ u_pbt_chartcartesian.TYPE_BAR, /*values*/ ld_empty)
uo_chart.of_add_series(/*key*/ "last", /*label*/ String(LAST_YEAR), /*type*/ u_pbt_chartcartesian.TYPE_LINE, /*values*/ ld_empty)
The type is set per series: columns and a line share the same axes. is_format is a DataWindow display format — the axis, the tooltips and the labels all follow it.
The doughnut #
// The doughnut : one slice per region, its total in the hole
uo_pie.is_title = "Sales by region, " + String(THIS_YEAR)
uo_pie.id_inner_radius = 0.6
uo_pie.is_format = '$#,##0"K"'
uo_pie.is_center_text = "[b]#hover_value#[/b][br]#hover_label#"
for ll_i = 1 to UpperBound(is_regions)
	uo_pie.of_add_slice(/*key*/ is_regions[ll_i], /*label*/ is_regions[ll_i], /*value*/ 0)
next
id_inner_radius turns the pie into a doughnut, and is_center_text writes in the hole: at rest the total, under the pointer the slice — #hover_value# and #hover_label# follow it by themselves.
The gauge #
// The gauge : this month so far, as a percentage of the monthly target
uo_gauge.is_title = "October vs target"
uo_gauge.id_maximum = 120
uo_gauge.is_unit = "%"
uo_gauge.is_format = "0"
uo_gauge.of_add_range(/*key*/ "low", /*from*/ 0, /*to*/ 80)
uo_gauge.of_add_range(/*key*/ "near", /*from*/ 80, /*to*/ 100)
uo_gauge.of_add_range(/*key*/ "met", /*from*/ 100, /*to*/ 120)
uo_gauge.of_range(/*key*/ "low").is_tone = u_pbt_angulargauge.TONE_DANGER
uo_gauge.of_range(/*key*/ "near").is_tone = u_pbt_angulargauge.TONE_WARN
uo_gauge.of_range(/*key*/ "met").is_tone = u_pbt_angulargauge.TONE_SUCCESS
A range takes a tone rather than a colour: red, amber and green that stay readable in the light and the dark themes.
Step 3 — The refresh: new values, not new charts #
wf_refresh reads the DataStore for the region chosen, and hands the figures to what is already drawn:
// wf_refresh () (extract)
// New values for the series already drawn : the bars SLIDE to their new height
uo_chart.of_set_series_values(/*key*/ "this", /*values*/ ld_this)
uo_chart.of_set_series_values(/*key*/ "last", /*values*/ ld_last)

// The monthly target, a line across the chart : 10 % over last year's average
ldc_target = Round(wf_sum(is_region, LAST_YEAR, 1, 12) / 12 * 1.1, 0)
uo_chart.of_clear_axis_sections(/*axis*/ u_pbt_chartcartesian.AXIS_VALUE)
uo_chart.of_add_axis_threshold(/*axis*/ u_pbt_chartcartesian.AXIS_VALUE, /*key*/ "target", /*at*/ ldc_target, /*color*/ RGB(/*red*/ 230, /*green*/ 120, /*blue*/ 40), /*thickness*/ 2)
of_set_series_values keeps the identity of the series: the columns slide to their new height instead of replaying their arrival. A threshold is a line across the plot — a target, a limit.
The doughnut takes all its values in one call, and the region chosen comes forward:
// The doughnut always shows every region ; the one chosen comes forward
for ll_i = 1 to UpperBound(is_regions)
	ls_keys[ll_i] = is_regions[ll_i]
	ld_values[ll_i] = wf_sum(is_regions[ll_i], THIS_YEAR, 1, LAST_MONTH)
	if is_regions[ll_i] = is_region then
		uo_pie.of_item(/*key*/ is_regions[ll_i]).id_push_out = 0.1
	else
		uo_pie.of_item(/*key*/ is_regions[ll_i]).id_push_out = 0
	end if
next
uo_pie.of_set_values(/*keys*/ ls_keys, /*values*/ ld_values)
And the gauge is one property — the needle moves to it, animated:
// The gauge : this month so far, against the monthly target ; the needle moves
ldc_month = wf_sum(is_region, THIS_YEAR, LAST_MONTH, LAST_MONTH)
uo_gauge.id_value = Round(ldc_month / ldc_target * 100, 0)
wf_sum is plain PowerScript: a loop over the DataStore. In a real application it is a SQL SUM ... GROUP BY, or a computed column of the DataWindow.
Step 4 — KPI tiles in rich text #
A KPI tile is a u_pbt_statictext with a frame, and its text is rich text: sizes, bold, colours, written right inside the string.
// constructor event of each tile
// A tile : a frame, rounded corners, room inside
this.ii_border_width = 1
this.ii_corner_radius = 8
this.ii_padding = 16
// wf_tile (u_pbt_statictext auo_tile, string as_title, string as_value, string as_note)
// A KPI tile : a title, a big value, a note. The value may carry markup of its own
// (the colour of a growth) ; the rest is written here.
auo_tile.is_text = as_title + "[br][size=24][b]" + as_value + "[/b][/size][br][gray]" + as_note + "[/gray]"The growth goes in green or red according to its sign:
// The tiles : rich text, the growth in green or red
if ldc_ytd >= ldc_ytd_last then
	ls_growth = "[green]+" + String((ldc_ytd - ldc_ytd_last) / ldc_ytd_last * 100, "0.0") + " %[/green]"
else
	ls_growth = "[red]" + String((ldc_ytd - ldc_ytd_last) / ldc_ytd_last * 100, "0.0") + " %[/red]"
end if
wf_tile(uo_kpi_growth, "Versus " + String(LAST_YEAR), ls_growth, "same months, " + String(ldc_ytd_last, "$#,##0") + "K")
Step 5 — Click a region, the whole page follows #
The list of regions and the doughnut drive the same filter. A click on a slice raises ue_slice_clicked with its key:
// ue_slice_clicked event of uo_pie : (string as_key, double ad_value)
// Local variables
long ll_index

// A region of the doughnut : the list shows it, and the whole dashboard follows ;
// the region already shown goes back to all of them
if parent.is_region = as_key then
	parent.is_region = ""
	parent.ddlb_region.SelectItem(1)
else
	parent.is_region = as_key
	ll_index = parent.ddlb_region.FindItem(as_key, 0)
	parent.ddlb_region.SelectItem(ll_index)
end if
parent.wf_refresh()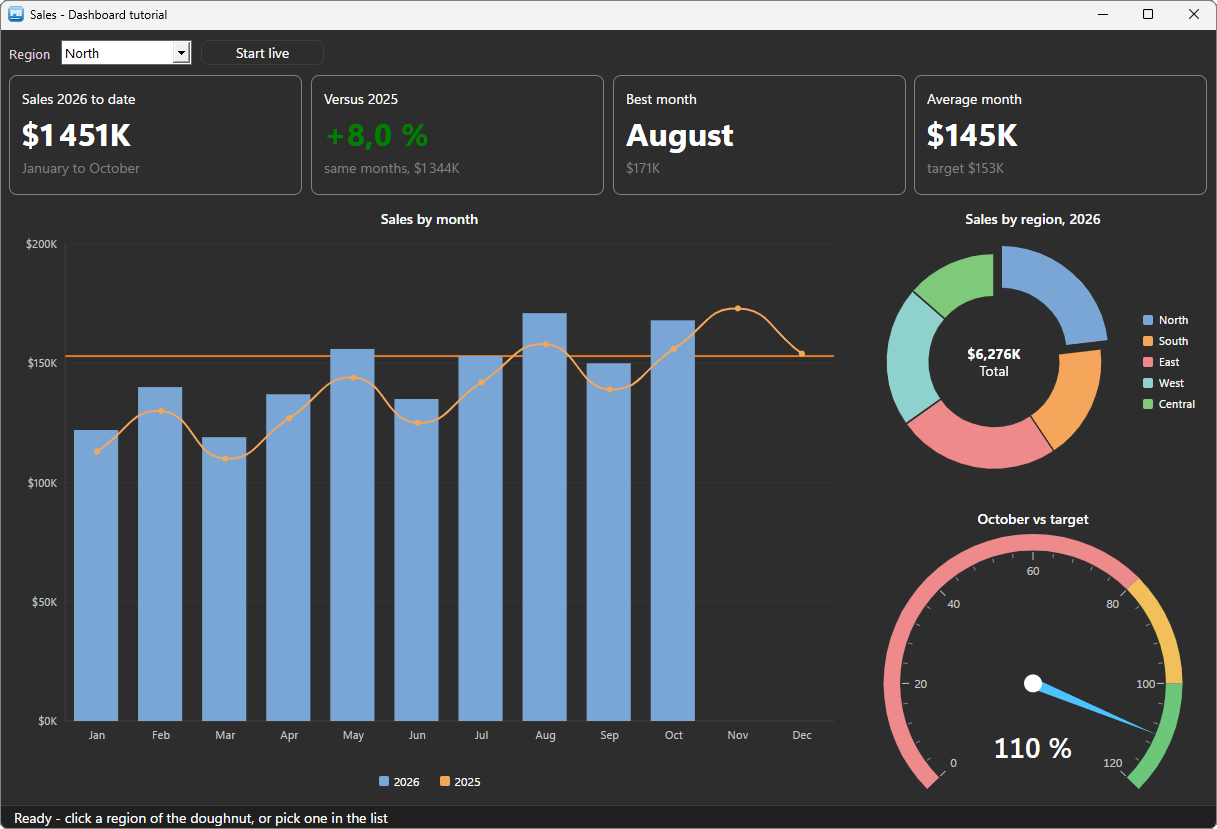
The chart answers too: a click on a column or a point raises ue_point_clicked, with the series, the position and the value — the place to open the detail of a month.
Step 6 — Live #
The last step makes the dashboard move. A timer adds an order to the current month of one region, then calls the same wf_refresh: the column grows, the doughnut turns, the needle moves, the tiles change.
// ue_clicked event of uo_live
// Live mode : a new order every two seconds, on the window's timer
parent.ib_live = not parent.ib_live
if parent.ib_live then
	Timer(2, parent)
	this.is_text = "Stop live"
else
	Timer(0, parent)
	this.is_text = "Start live"
end if
// wf_new_order () (extract)
// An order arrives : it adds to this month's sales of one region
ll_row = ids_sales.Find("region = '" + ls_region + "' and year = " + String(THIS_YEAR) + " and month = " + String(LAST_MONTH), 1, ids_sales.RowCount())
if ll_row < 1 then return
ids_sales.SetItem(ll_row, "amount", ids_sales.GetItemDecimal(ll_row, "amount") + ldc_amount)
// Everything follows : the bars slide, the doughnut turns, the needle moves
wf_refresh()In a real application the timer reads the database again every minute, or a message from your server says that new data is there: the refresh is the same.
Themes and layout #
Every component follows the theme set by PBT_SetDefaultTheme, light or dark: the axes, the legends, the tones of the gauge. A tile reports the background of the theme by ue_bg_color, and the window and its native controls follow it. The resize event of the window places the tiles in four equal columns, the chart on the left and the doughnut and the gauge on the right.
Deploying #
Next to your executable, ship:
my_app.exe
pbtoolboxai.dll     <- the x86 or the x64 copy, matching your build
The DLL has the same name in 32 and 64 bit: you develop in the 32-bit IDE and compile a 64-bit executable without changing a line of PowerScript. Call PBT_SetLicense with your key in the application open event, and the demo limits go away.
Going further #
- Charts from a DataStore:
of_from_datastoreandof_map(ROLE_CATEGORY / ROLE_SERIES / ROLE_VALUE, column)build a chart from the rows of a DataWindow in one call. - A second value axis: a series with
ib_secondary = truedraws on its own scale — revenue and number of orders on the same chart. - Stacked columns, horizontal bars, areas, scatter, candlesticks: the type of each series.
- Images:
of_save_as_pngandof_print_to_pdfput a chart in a report or an e-mail. - A linear gauge (
u_pbt_gauge) for a progress against a target in a narrow tile.
Every method, property and event is in the references of the cartesian chart, the pie chart and the angular gauge.
And if you write PowerScript with Claude, Cursor or VS Code, connect them to the PBToolboxAI documentation MCP server: your assistant then looks up the exact API instead of guessing, and checks the code it proposes. The code of this tutorial was checked that way.
Download: the PBToolboxAI demonstration package — free: the library, the DLL, and the sample of this tutorial in the Tutorials tab of the demo.