Guides · Tutorial
A modern data grid in PowerBuilder, fed by your DataStore
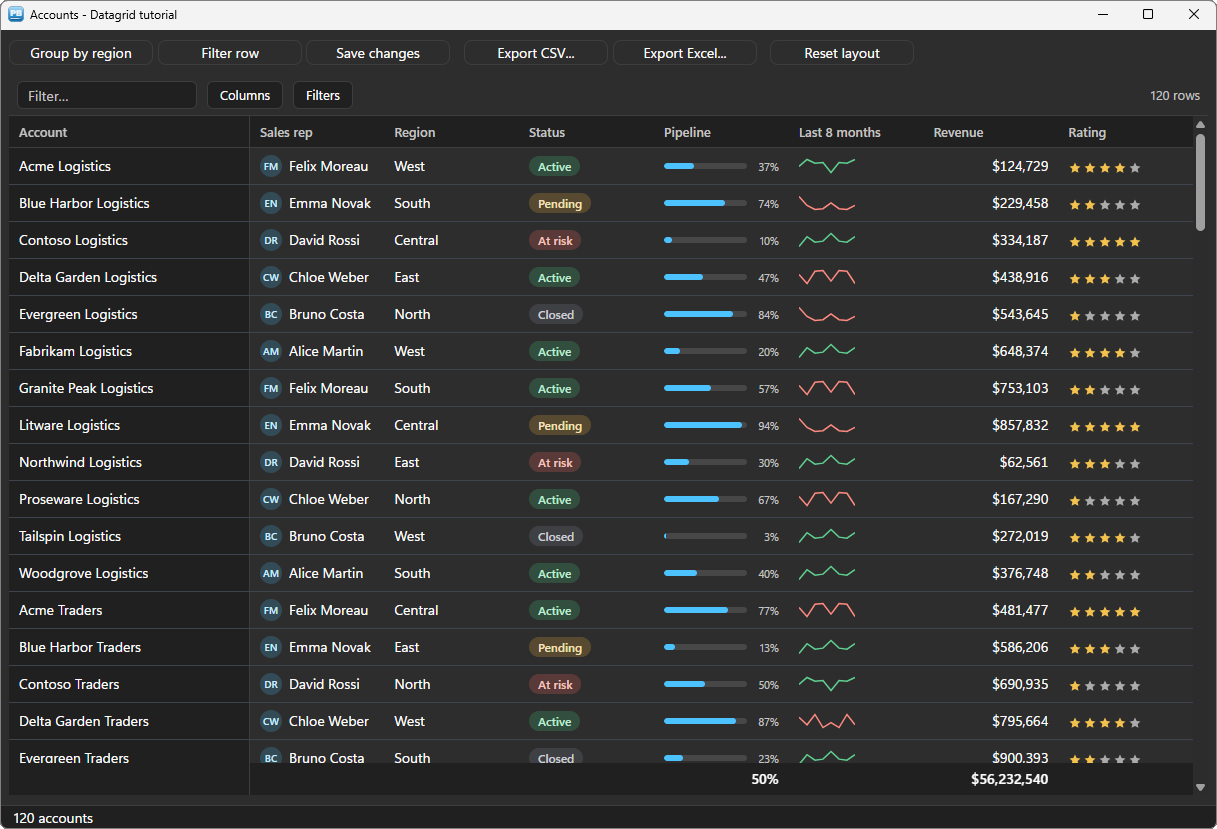
The DataWindow is the heart of every PowerBuilder application, and nothing replaces it for reading and writing data. Its look, though, has not moved in twenty years: a grey grid, no search box, no grouping the user can change, no filter row, no export to Excel without code. Users compare it with the web applications they use every day.
This tutorial keeps the DataWindow where it is good — retrieving, holding and updating the data — and shows that data in u_pbt_datagrid, a modern grid driven entirely in PowerScript: rich cells, totals, grouping, filters, editing in place written back into the DataStore, a row menu, CSV and Excel exports, and the user's layout kept from one session to the next. It works from PowerBuilder 10.2 to 2025, with no ActiveX and no .NET.
We will build a small portfolio of customer accounts. Every line of code below comes from the sample application: the window w_tuto_datagrid of the PBToolboxAI demo, opened by its Tutorials tab.
What you need #
- PowerBuilder 10.2 → 2025 (32 or 64 bit).
- Windows 10 or 11: the Microsoft WebView2 runtime the components rely on is already there.
- The PBToolboxAI demonstration package — free, from the downloads page. It holds
pbtoolboxai.pbl,pbtoolboxai.dlland the sample application of this tutorial.
The finished code. Open
pbtoolboxai_demo.pbwfrom the demonstration package and run it: the Tutorials tab of its ribbon opens the sample of this tutorial, the windoww_tuto_datagrid, with its DataWindow objectd_tuto_accounts. Their source is inpbtoolboxai_demo.pbl, ready to read or to copy.Demo mode. In your own application, without a licence key, the grid runs in demo mode: 100 rows shown at most, no export, and a small DEMO badge. The sample holds 120 accounts.
Step 1 — Prepare the target #
- Copy
pbtoolboxai.pblinto your application folder and add it to the library list of your target. - Copy
pbtoolboxai.dll— the x86 copy, since the PowerBuilder IDE is 32-bit — next topbXXX.exeor into the working folder of the target, so that the IDE finds it when you run.
Then, in the open event of the application object, give the licence and the theme before the first window opens:
// Local External Functions of the application object
Function long PBT_SetLicense (string as_client, string as_key) Library "pbtoolboxai.dll"
Function long PBT_SetDefaultTheme (string as_name) Library "pbtoolboxai.dll"
// open event of the application object
// Your licence key. Without one the grid runs in demo mode : 100 rows, no export
PBT_SetLicense(/*client*/ "Your company", /*key*/ "your-licence-key")
// The theme of every component
PBT_SetDefaultTheme(/*name*/ "fluent-dark")
Open(w_accounts)Step 2 — The DataWindow stays the master #
The data is retrieved the way your application already does it: a DataWindow object, a DataStore, Retrieve(). The grid reads that DataStore; it never replaces it. d_tuto_accounts is an ordinary grid DataWindow with eight columns — account, sales rep, region, status, pipeline, a trend, revenue and rating — and the sample fills it with typed SetItem instead of a database:
// open event of the window (extract)

// The accounts, then the grid around them
ids_accounts = create datastore
ids_accounts.DataObject = "d_tuto_accounts"
wf_load()
wf_setup_grid()
wf_layout()
In the window painter, the grid is a userobject of class u_pbt_datagrid, named uo_grid. Its first line of code is the bridge:
// The grid reads the DataStore : the titles, the $#,##0 of the revenue and the code
// tables of the status and the rating come from the DataWindow itself
uo_grid.of_from_datastore(/*ads*/ ids_accounts)
That one call brings everything the DataWindow says about its columns: the header texts become the titles, the display format $#,##0 applies to the revenue, and a code table shows its display value — the rating column holds 1 to 5, the grid shows Poor to Excellent and keeps the number. Sorting by a click on a header, the search box, the column chooser and resizing come for free.
Each row is named by its RowID: a key that does not move when the DataStore sorts, filters, inserts or deletes. ids_accounts.GetRowFromRowId(Long(key)) is the row it designates now.
Step 3 — Rich cells #
A number is easier to read as a gauge, a status as a coloured chip, a list of figures as a small chart. Each column takes a renderer:
// Rich cells : an avatar, a coloured status, a gauge, a mini chart, stars
uo_grid.of_column(/*key*/ "rep").is_renderer = n_pbt_datagrid_column.RENDERER_AVATAR
uo_grid.of_column(/*key*/ "status").is_renderer = n_pbt_datagrid_column.RENDERER_CHIP
uo_grid.of_column(/*key*/ "status").is_tones = "Active=" + n_pbt_datagrid_column.TONE_SUCCESS + "|Pending=" + n_pbt_datagrid_column.TONE_WARN + "|At risk=" + n_pbt_datagrid_column.TONE_DANGER
uo_grid.of_column(/*key*/ "pipeline").is_renderer = n_pbt_datagrid_column.RENDERER_PROGRESS
uo_grid.of_column(/*key*/ "trend").is_renderer = n_pbt_datagrid_column.RENDERER_SPARKLINE
uo_grid.of_column(/*key*/ "rating").is_renderer = n_pbt_datagrid_column.RENDERER_RATING

// The account stays in view when the grid scrolls sideways
uo_grid.of_column(/*key*/ "account").is_pin = n_pbt_datagrid_column.PIN_START
The data does not change for that: the trend column holds a plain text such as "3,5,2,6,8,7,9,12", and the grid draws it as a line. is_tones gives each status its colour, from the theme — the same chip reads well in the light and the dark themes.
Step 4 — Totals, grouping and filters #
A summary on a column puts its total in the footer, and in every group:
// Totals in the footer : the sum of the revenue, the average pipeline
uo_grid.of_column(/*key*/ "revenue").is_summary = n_pbt_datagrid_column.SUMMARY_SUM
uo_grid.of_column(/*key*/ "pipeline").is_summary = n_pbt_datagrid_column.SUMMARY_AVG
Grouping is one property. The sample's button switches it:
// ue_clicked event of uo_group
// One property groups the rows : a header per region, with its own subtotals
if parent.uo_grid.is_group_by = "" then
	parent.uo_grid.is_group_by = "region"
	this.is_text = "Ungroup"
else
	parent.uo_grid.is_group_by = ""
	this.is_text = "Group by region"
end if
Several levels are joined by |: "region|rep". The user can also drag a column header onto the grouping area, or open its menu. A row of filters under the headers is one more property:
// ue_clicked event of uo_filters
// A row of filters under the headers : one field per column
parent.uo_grid.ib_filter_row = not parent.uo_grid.ib_filter_row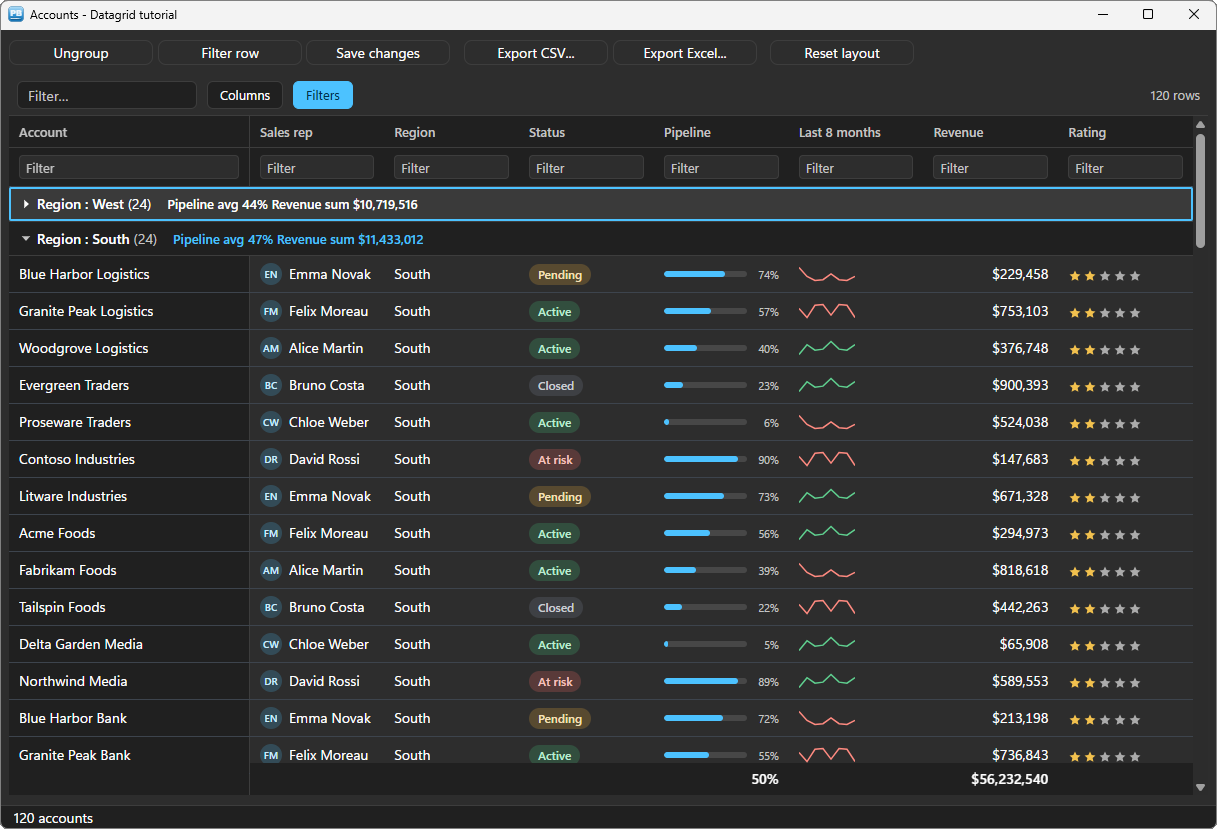
Sorting, grouping and filtering happen in the grid: the DataStore keeps its rows in their order, so nothing of your code that reads it changes.
Step 5 — Editing in place, written back into the DataStore #
The status, the revenue and the rating are edited in the grid: a double-click or F2 opens the cell, Enter validates. A column with a code table opens a list of its values; the chosen data value goes into the row.
// The status, the revenue and the rating are edited in place ; every value goes
// into the DataStore (ib_write_back), after ue_cell_editing agreed (ib_veto_edits)
uo_grid.of_column(/*key*/ "status").ib_editable = true
uo_grid.of_column(/*key*/ "revenue").ib_editable = true
uo_grid.of_column(/*key*/ "rating").ib_editable = true
uo_grid.ib_write_back = true
uo_grid.ib_veto_edits = true
With ib_write_back, the grid does the SetItem itself, typed by the column, before it raises ue_cell_edited: the DataStore stays the master, and its ModifiedCount() is right. With ib_veto_edits, your code is asked first, and can refuse:
// ue_cell_editing event of uo_grid : (string as_key, string as_col, string as_value) returns boolean
// Asked BEFORE a value is kept (ib_veto_edits) : false leaves the old value
if as_col = "revenue" and Left(Trim(as_value), 1) = "-" then
	parent.wf_status("A revenue cannot be negative : the value was refused")
	return false
end if
return true
A changed cell carries a small mark until the next save. Saving is yours — Update() — and then the grid forgets its marks:
// wf_save ()
// A real application calls ids_accounts.Update() here. The grid then forgets
// the marks of the cells changed since the last save.
if ids_accounts.ModifiedCount() = 0 then
	wf_status("Nothing to save")
	return
end if
wf_status(String(ids_accounts.ModifiedCount()) + " row(s) saved")
ids_accounts.ResetUpdate()
uo_grid.of_reset_update()
When your code changes a row of the DataStore, of_reload_row(row) shows that one row again — the next step does it for a whole selection.
Step 6 — Selection and the row menu #
The user selects several rows (Ctrl+click, Shift+click). The selection arrives as a JSON array of RowIDs, and the sample sums the revenue of the rows selected in its status bar, as a spreadsheet does:
// The accounts selected : Ctrl+click, Shift+click
uo_grid.is_selection_mode = uo_grid.SELECT_MULTIPLE
// wf_selected_rows (string as_keys_json, ref long al_rows[]) returns long
// Local variables
long ll_quote, ll_end, ll_count, ll_row
// '["3","7"]' : the RowIDs of the rows selected. Each one gives its row in the
// DataStore now, whatever the sort or the filter of the grid.
ll_quote = Pos(as_keys_json, '"')
do while ll_quote > 0
ll_end = Pos(as_keys_json, '"', ll_quote + 1)
ll_row = ids_accounts.GetRowFromRowId(Long(Mid(as_keys_json, ll_quote + 1, ll_end - ll_quote - 1)))
if ll_row > 0 then
ll_count++
al_rows[ll_count] = ll_row
end if
ll_quote = Pos(as_keys_json, '"', ll_end + 1)
loop
return ll_countThe right-click menu of a row already offers copy and export; your own entries join it:
// Two entries of our own in the right-click menu of a row
uo_grid.of_add_row_menu_separator()
uo_grid.of_add_row_menu_item(/*key*/ "atrisk", /*label*/ "Mark as at risk")
uo_grid.of_add_row_menu_item(/*key*/ "call", /*label*/ "Call the sales rep")
The entry chosen comes back with the row clicked and the whole selection — what a batch action works on:
// ue_row_menu_clicked event of uo_grid : (string as_menu_key, string as_row_key, string as_keys_json)
// Local variables
long ll_row

// One of OUR entries of the row menu : as_row_key is the row clicked, as_keys_json
// the whole selection, what a batch action works on
choose case as_menu_key
	case "atrisk"
		parent.wf_mark_at_risk(as_keys_json)
	case "call"
		ll_row = parent.ids_accounts.GetRowFromRowId(Long(as_row_key))
		parent.wf_status("Calling " + parent.ids_accounts.GetItemString(ll_row, "rep") + " about " + parent.ids_accounts.GetItemString(ll_row, "account"))
end choose
// wf_mark_at_risk (string as_keys_json)
// Local variables
long ll_rows[], ll_count, ll_i
// A batch action works on the whole selection : the DataStore first, then each
// changed row travels to the grid again
ll_count = wf_selected_rows(as_keys_json, ll_rows)
for ll_i = 1 to ll_count
ids_accounts.SetItem(ll_rows[ll_i], "status", "At risk")
uo_grid.of_reload_row(/*row*/ ll_rows[ll_i])
next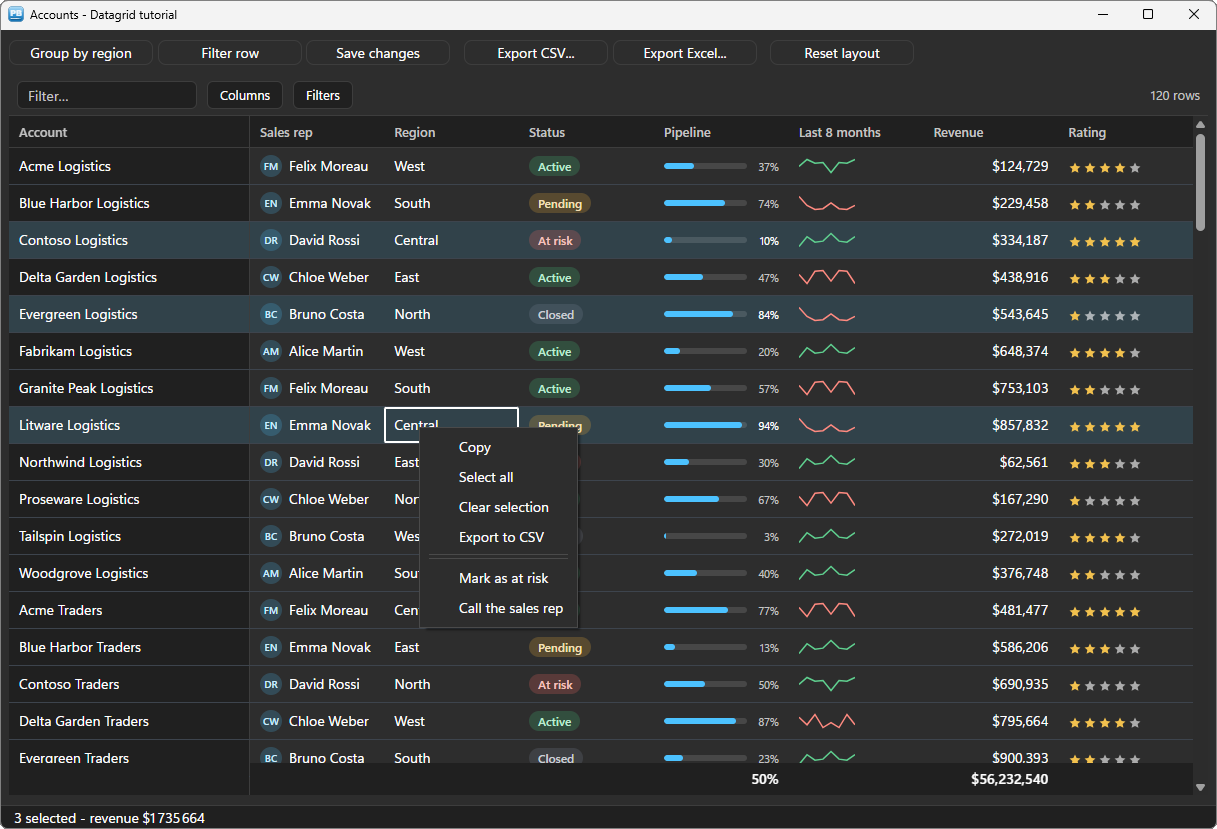
Step 7 — Exports, and the user's layout #
The grid exports what it shows — the filters, the sort and the visible columns — to CSV or to a real Excel workbook, where numbers stay numbers with the format of their column:
// wf_export (string as_kind)
// Local variables
string ls_path, ls_name

// The grid writes what it SHOWS : the filters, the sort and the visible columns.
// The answer comes in ue_csv_saved or ue_xlsx_saved.
if as_kind = "csv" then
	if GetFileSaveName("Export to CSV", ls_path, ls_name, "csv", "CSV files (*.csv),*.csv", /*initdir*/ "", OFN_EXPLORER + OFN_NOCHANGEDIR) <> 1 then return
	uo_grid.of_export_csv(/*path*/ ls_path)
else
	if GetFileSaveName("Export to Excel", ls_path, ls_name, "xlsx", "Excel workbooks (*.xlsx),*.xlsx", /*initdir*/ "", OFN_EXPLORER + OFN_NOCHANGEDIR) <> 1 then return
	uo_grid.of_export_xlsx(/*path*/ ls_path)
end if
OFN_EXPLORER (2) and OFN_NOCHANGEDIR (64) are two constants of the window, in PowerBuilder values: the Explorer-style dialog, and the current folder of the application left where it was — without the second one, every relative path used afterwards resolves in the folder the user just visited.
The file is written by the DLL, and the grid says when it is done:
// ue_xlsx_saved event of uo_grid : (string as_path, boolean ab_ok, string as_error)
// The workbook is written, or the reason why not
if ab_ok then parent.wf_status("Exported : " + as_path) else parent.wf_status("Export failed : " + as_error)
Last, the arrangement the user makes — columns moved, resized, hidden, the sort, the grouping, the filter row — is one JSON text, the property is_layout. Saved when the window closes, given back when it opens:
// open event of the window (the end)
// The layout the user left last time : columns moved, resized, hidden, the sort,
// the grouping. Reset gives back the one of the first opening.
is_default_layout = uo_grid.is_layout
RegistryGet(REGISTRY_KEY, "Layout", RegString!, ls_layout)
if ls_layout <> "" then uo_grid.is_layout = ls_layout
// close event of the window
// The layout of the user, for the next opening
RegistrySet(REGISTRY_KEY, "Layout", RegString!, uo_grid.is_layout)
destroy ids_accountsREGISTRY_KEY is a constant of the window; an INI file or a table of your database would do as well. Writing is_default_layout back is the Reset layout button.
Themes #
The grid follows the theme set by PBT_SetDefaultTheme — light or dark, Fluent or Office — chips, gauges and stars included. Its ue_bg_color event reports the background of the theme, so that the window follows too (the status bar, a PBToolboxAI component, follows by itself):
// ue_bg_color event of uo_grid : (long al_color)
// The theme's background (a new theme, a new mode) : the window follows
parent.wf_follow_background(al_color)
Deploying #
Next to your executable, ship:
my_app.exe
pbtoolboxai.dll     <- the x86 or the x64 copy, matching your build
The DLL has the same name in 32 and 64 bit: you develop in the 32-bit IDE and compile a 64-bit executable without changing a line of PowerScript — only the copied file changes. Call PBT_SetLicense with your key in the application open event, and the 100-row limit and the demo badge go away.
Going further #
- Large tables: a windowed source (
of_open_source,ue_rows_needed) asks your code for the rows on screen only, page by page — a million rows without loading them. - Detail rows:
ib_detail_on_demandandue_detail_neededopen a panel under a row, in rich text. - Formats of your own:
is_formaton a column, in the DataWindow's syntax, andis_maskfor the typing of a number. - Drop-down DataWindows: a column whose edit style is a DropDownDataWindow shows the display value of its child.
Every method, property and event is in the datagrid reference.
And if you write PowerScript with Claude, Cursor or VS Code, connect them to the PBToolboxAI documentation MCP server: your assistant then looks up the exact API instead of guessing, and checks the code it proposes. The code of this tutorial was checked that way.
Download: the PBToolboxAI demonstration package — free: the library, the DLL, and the sample of this tutorial in the Tutorials tab of the demo.